
August 14, 2026
Process Selection Whitepaper - Phase I
How to Select an Optimal Process Technology
Executive Summary
Process selection is one of, if not the, highest-leverage decision in semiconductor product development. It establishes the technical and economic environment within which the product must succeed: cost, engineering schedule, manufacturing economics, qualification risk, and future product roadmaps. Once a design team converges around a process technology, changing direction can become exhaustive rather than a routine engineering adjustment. And yet many fabless companies oversimply process selection. Node geometry, wafer diameter, wafer cost, and foundry scorecards oversimplify the decision.
This whitepaper takes the stance that process selection should be significantly more systematized, analytical, and relationship neutral than most fabless companies currently practice and provides a streamlined flow for process selection that begins with the product's unique selling points. These capabilities ultimately cause customers to select the product, pay a premium for it, or integrate it into their own systems. These sources of differentiation must be ruthlessly optimized from customer requirements into IC requirements and semiconductor process constraints.
The process selection methodology presented here, the Technology Selection Funnel, applies to all fabless semiconductor products, rather an HPC accelerator chip or an analog mixed signal automotive IC because it builds out from what differentiates the product itself.
To summarize, the central premise of this paper is:
Semiconductor process selection is a structured, multi-variable optimization problem that should begin with the product's unique selling points and the technical capabilities required to deliver them. Those requirements should progressively narrow the semiconductor technology landscape until only a small number of technically and economically viable process technologies remain (Phase I) for detailed evaluation and final selection (Phase II).
Five competing objectives govern that optimization:
- Technical capability — Can the process technology deliver the functionality and performance required to create the product's differentiation?
- Total product economics — Does it produce attractive lifetime economics after accounting for development investment, manufacturing, engineering, qualification, test, packaging, and expected volume?
- Risk — What technical, manufacturing, qualification, schedule, and organizational uncertainties accompany the choice?
- Time-to-market — How does the technology affect development time, customer qualification, and the timing of revenue?
- Strategic flexibility — Does the decision support future derivatives, IP reuse, and the expected product roadmap without paying excessively for hypothetical capability?
The goal in process selection is to strategically prioritize the points above that optimize the product's unique selling points.
The primary framework developed in this paper—the Technology Selection Funnel—provides a structured way to navigate these tradeoffs. Product differentiation is translated into measurable requirements. Hard constraints then eliminate process technologies that cannot satisfy the product, while optimization criteria distinguish among those that remain. The analysis progresses through electrical and device requirements, functional integration, performance, architecture, qualification, lifecycle considerations, and economics until the initial technology universe has been reduced to approximately two to five credible candidates.
 The framework is intentionally technology-neutral. For one product, the analysis may conclude that migration to a smaller node creates insufficient value to justify the engineering effort. For another, aggressive scaling may be essential to delivering a commercially competitive product. The methodology should not systematically favor mature nodes, advanced nodes, lower cost, higher performance, or lower risk. It should favor the combination that produces the strongest product-level outcome.
This paper also separates two phases that are often conflated.
Phase I determines the appropriate process technology strategy. It answers: What process technologies best enable the product's differentiation while satisfying its technical and economic constraints?
Phase II evaluates specific foundry implementations. It answers: Which foundry and specific process provide the best way to execute that technology strategy?
Separating these decisions prevents incumbent supplier relationships, commercial terms, or familiarity with a particular manufacturing partner from prematurely determining the technology choice. We are able to separate phase I and II due to generalizations at classes of technology nodes (eg 180nm BCD vs 90nm BCD), but must be specific in phase II to optimize where needed.
The output of Phase I is therefore a defensible technology strategy after funneling through the entire foundry landscape. This strategy includes a shortlist of viable process technologies, a preferred option, a credible alternative, and a documented understanding of the assumptions and risks that determine which technology should win.
1. The Cost of Choosing the Wrong Process
Few decisions made during semiconductor product development have consequences that persist as long—or become as expensive to reverse—as process technology selection.
The selected technology influences the design company's technical and economic foundation of success, while also committing to a platform for company roadmap.Interestingly, the resulting failures are not always dramatic. Often, the product works. It simply costs more than necessary, arrives later than planned, consumes excessive engineering resources, or constrains future derivatives.
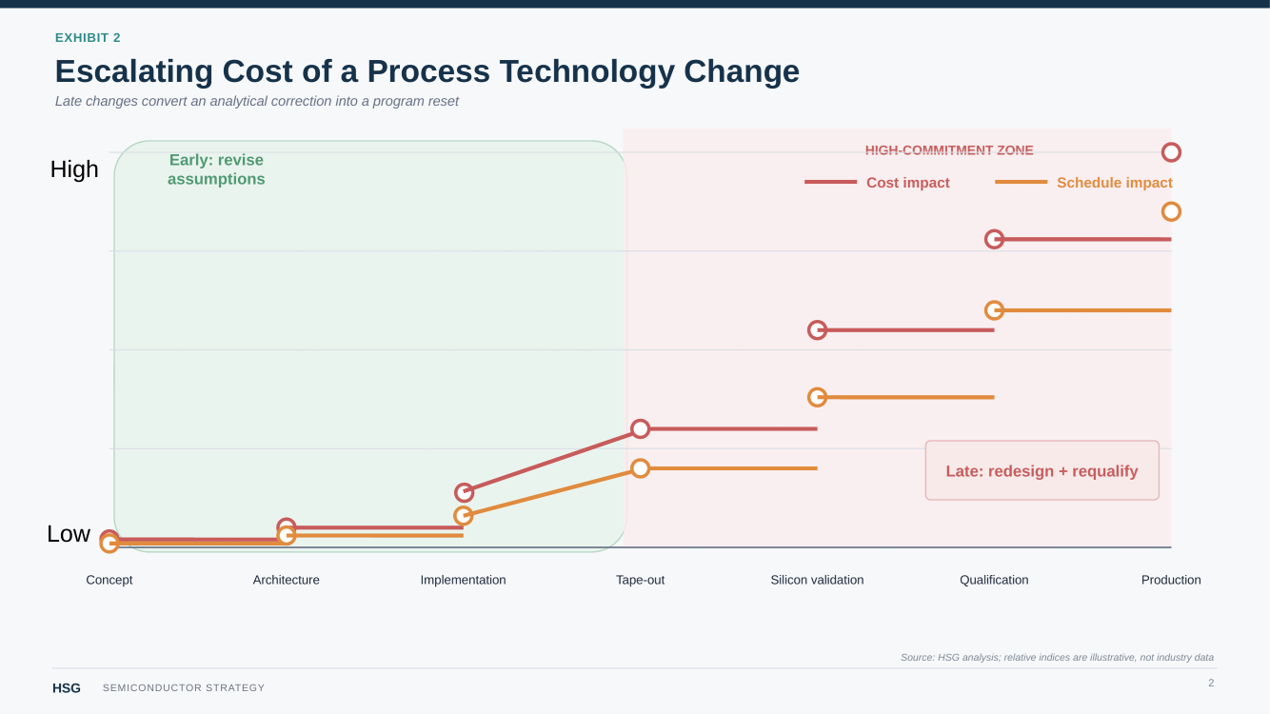
The Cost Escalates with Commitment
Early in product planning, changing a technology assumption may require only additional analysis. Once architecture, IP selection, software assumptions, verification environments, and qualification plans converge around a process technology, the same change can require redesign, renewed validation, revised customer schedules, and additional qualification. The sunk costs are difficult, though not always impossible, to recover from.
Consider an industrial mixed-signal ASIC integrating high-voltage devices, embedded NVM, precision analog, and moderate digital control aiming to build a next generation product. A smaller node may appear attractive because it offers higher density and more GDPW. But if digital logic represents only a minority of the finished die, or if resulting yield is substantially lower, the total die shrink may not justify the smaller node's cost. The company should first ask, what is the unique selling point we are trying to optimize for in this next generation product? Even if it is truly to undercut cost and maintain equal performance, the answer is still not automatically smaller node, larger wafer diameter or lower wafer price as these shorthands are dependent on achritectural and economic environments of each unique product. The smaller node may be technically superior while producing a weaker product-level return.
Process Decisions Persist Across Product Families
A process technology does not support only one tape-out. Design companies often wish to establish an environment within which knowledge can compound across multiple products.
A decision optimized narrowly for first silicon can therefore create costs that become visible only in later derivatives. The opposite risk is over-investment. Paying for technology headroom that no credible roadmap consumes results in unused capability funded in advance.
The decision must therefore be anchored to what the product—and product family—is actually intended to accomplish. The organization must optimize the product around its USPs and translate these into process requirements. Designing into the sexiest technology does not automatically improve product success.
2. A Framework for Process Selection
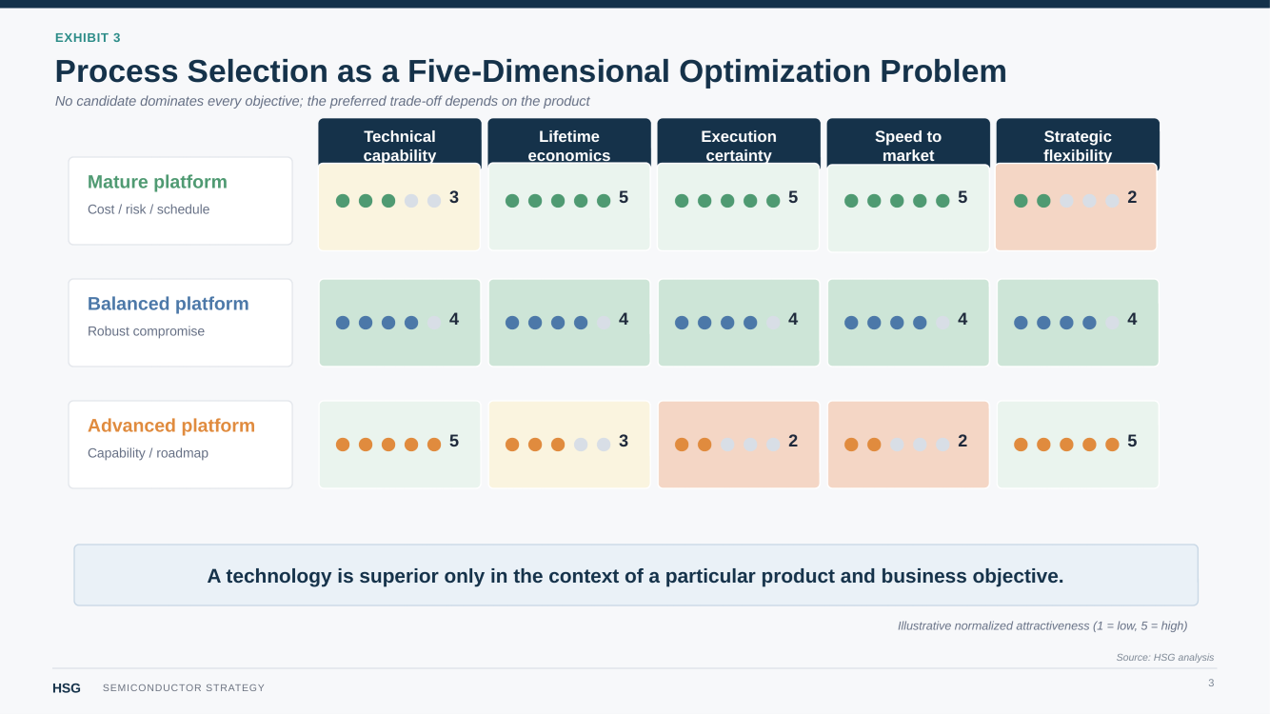
Process selection becomes more disciplined when the organization stops searching for a universal technology ranking (ie foundry scorecard) and instead evaluates candidates against a consistent set of objectives as shown in Exhibit 3.
Technical Capability
The first question is: Can this process technology deliver the capabilities that make the product valuable?
Technical capability establishes the feasible solution space. Requirements may include voltage, device options, embedded memory, analog or RF performance, digital performance, reliability, or integration capabilities.
A technology that fails a mandatory requirement should be eliminated rather than allowed to compensate through advantages elsewhere.
Once several technologies meet the minimum requirements, however, technical capability often becomes an optimization dimension rather than a gating factor.
Total Product Economics
Fabless companies should look at total lifetime product value, not a single manufacturing metric like wafer cost. Development investment, masks, IP, engineering effort, die area, yield, packaging, test, qualification, schedule, and expected volume all interact. A higher-cost technology may be justified if it materially improves unit economics or customer value. A lower-cost technology may dominate when volumes are modest and fixed engineering costs matter more. Economics must therefore be modeled at the product level across the project's lifetime.
Risk
Process selection occurs under uncertainty. The objective is not to eliminate risk, but to understand which risks are being accepted and what value the company expects in return.
Time-to-Market
A delay can postpone revenue, miss qualification windows or, more likely, consume expensive engineering resources required elsewhere.
Strategic/Roadmap Flexibility
Process technologies create platforms through IP reuse and engineering knowledge. Strategic flexibility deserves investment when a credible roadmap consumes it, but should not become an unlimited budget for hypothetical future requirements.
The Practical Meaning of Optimization
Multivariable optimization requires highly data driven analysis. Greater technical capability may increase cost and execution risk, but can deliver superior product where it matters most. A faster schedule may require accepting higher unit cost and vice versa. A mature platform may reduce uncertainty while limiting future headroom.
In practical terms, the candidates occupy different points on a Pareto frontier: improving one important objective frequently requires sacrificing another.
The reusable mental model is straightforward: A process technology is superior only in the context of a particular product and business objective.
The decision process therefore begins by identifying what makes the product commercially valuable and translating that differentiation into requirements that semiconductor technology must satisfy.
3. Translating Product Differentiation into Process Constraints
The most important work in process selection occurs before candidate technologies are compared. Though it is tempting to call up foundries and start talking to them as soon as possible, fabless companies must restrain themselves and think deeply about what it is they wish to achieve with a process technology.
The translation chain is:
Product differentiation → customer requirement → system requirement → IC requirement → process constraint
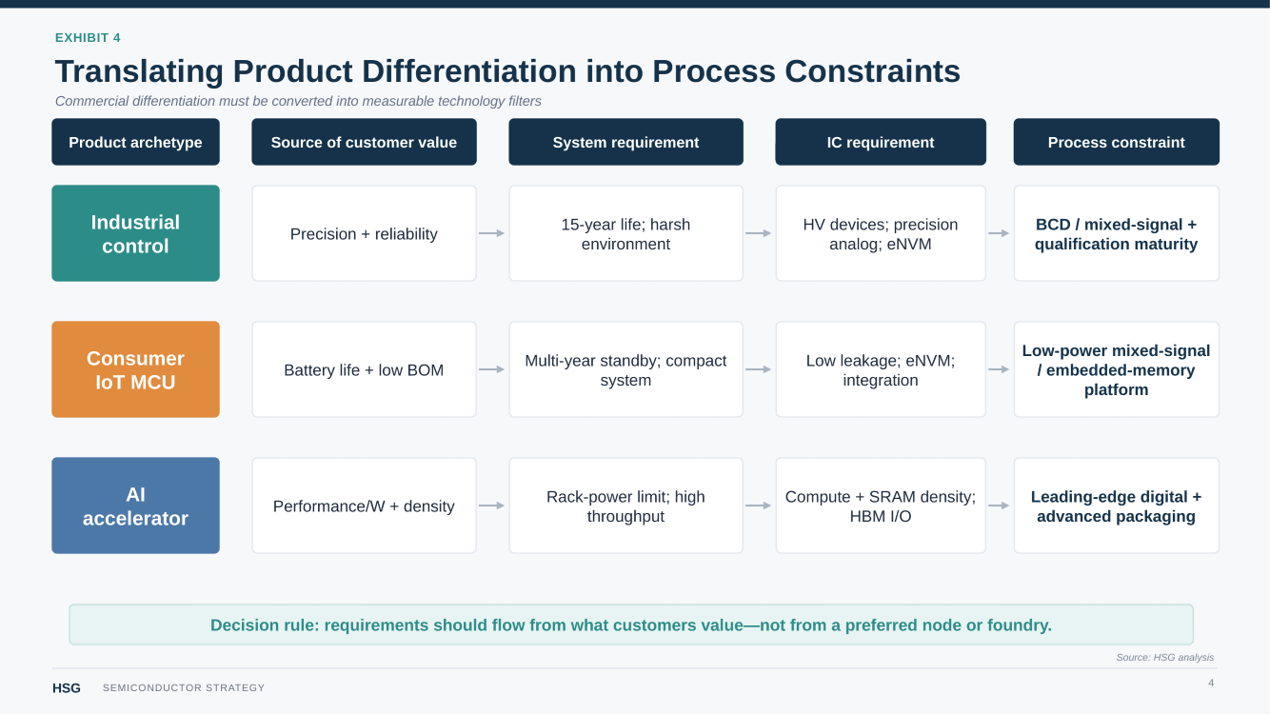
The examples in exhibit 4 are simple and high-level, but nonetheless an important part of the flow. An industrial motor-control IC may compete on precision sensing and high-voltage integration while another may compete on reliability and long product availability. A consumer IoT MCU may compete on unit cost and standby power, while another competes on integration, and package size. A high-performance accelerator may derive its value from total compute throughput, while another focuses on performance per watt.
These products should not follow the same technology roadmap because their unique selling points impose different constraints.
A requirement for multi-year battery life becomes standby-current and active-power targets. Industrial reliability becomes operating-temperature, voltage, fault, qualification, and lifetime requirements. AI throughput becomes compute, memory-bandwidth, latency, and power targets.
System architecture then determines which capabilities must reside on the primary die. This creates IC requirements such as operating voltages, memory architecture, analog functionality, interfaces, compute performance, and reliability.
The key fact here is that some metrics become hard constraints, where violating them makes the product unacceptable, while others become optimization criteria, where exceeding them can improve the product but is not required for feasibility.
This distinction prevents teams from optimizing technologies that will eventually fail a mandatory requirement, while also preventing architectural preferences from unnecessarily eliminating viable options.
Commercial requirements often fall into the optimization criteria window, but are nonetheless critical to product success. A product can only sell if it works. However, expected volume, product lifetime, development budget, and engineering resources can make a technically feasible process economically irrational.
Product roadmaps should inform the decision without dominating it. Future capability has value when a credible derivative is likely to use it; otherwise, the company is paying today for speculative flexibility.
The result of this translation is not a preferred node. It is a set of technical and commercial constraints against which the semiconductor technology landscape can be screened.
4. The Technology Selection Funnel
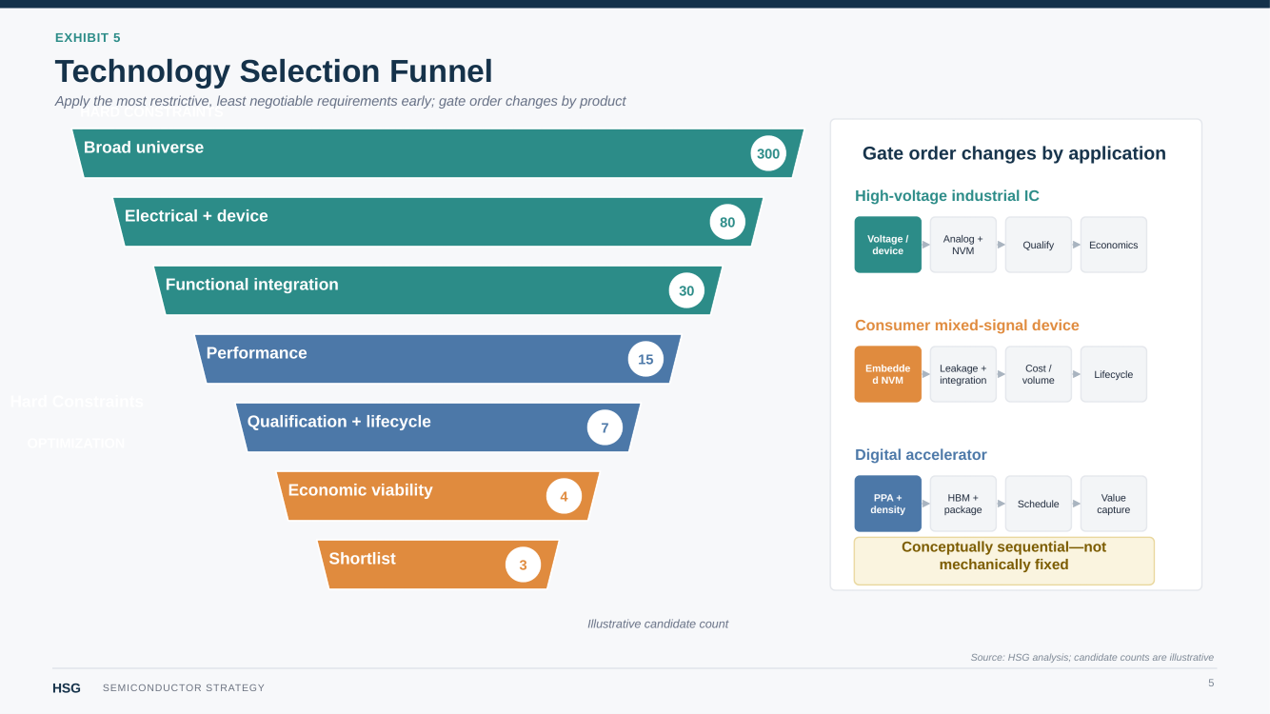
The Technology Selection Funnel progressively reduces the broad technology universe previously derived into approximately two to five credible process technologies.
Hard constraints determine viability and optimization criteria distinguish among viable technologies.
The funnel is conceptually sequential but not mechanically fixed. Teams should evaluate the most restrictive, least negotiable requirements early. Voltage may dominate an industrial power IC, embedded NVM for an MCU, RF capability for a communications device, or compute density an accelerator.
Gate 1 — Voltage and Device Requirements
Decision question: Can the process technology support every required voltage domain and device structure?
Typical classification: Hard constraint.
Nominal operating voltage rarely captures the complete requirement. An IC may combine a low-voltage digital core with higher-voltage I/O, analog circuitry, power-management functions, isolation structures, gate drivers, or high-current outputs.
Engineering should define the complete voltage and device architecture before comparing secondary metrics.
Common failure mode: Defining voltage requirements at the block level rather than from the complete system.
Gate 2 — Power and Thermal Constraints
Decision question: Can the technology satisfy the product's power budget within its intended operating environment?
Typical classification: Hard constraint at the system limit; optimization criterion thereafter.
Power (dynamic or static) cannot be inferred from technology node alone. Workload, architecture, memory hierarchy, voltage, leakage, software, package characteristics, and cooling all matter. Additional efficiency has value only when it produces a meaningful system outcome.
Common failure mode: Optimizing a generic power metric instead of the mechanism that constrains the product.
Gate 3 — Specialized Device Requirements
Decision question: Does the architecture depend on capabilities available only within specific technology classes?
Typical classification: Hard constraint.
BCD devices, specialized RF devices, SOI-based isolation, SiGe devices, photonic components, MEMS structures, or specialized high-voltage devices can sharply reduce the candidate universe.
A mandatory device occupying a small percentage of the die can eliminate most otherwise attractive technologies. Area contribution is therefore a poor measure of its importance to process selection.
Common failure mode: designing around a critical device when processes exist that satisfy the minimum requirement.
Gate 4 — Embedded Memory and Functional Integration
Decision question: What memory must reside on the primary die, and which characteristics are genuinely required?
Typical classification: Hard constraint when integration is mandatory; otherwise an architectural tradeoff.
SRAM is available across many process technologies, although density, leakage, voltage, and performance vary. Embedded Flash, EEPROM, MRAM, and other NVM options are more restrictive and must be evaluated for characteristics such as endurance, retention, programming requirements, operating temperature, and qualification maturity.
The more consequential question may be whether the memory must be embedded at all.
External memory or a companion die can reopen attractive process technologies otherwise excluded by an NVM requirement. But doing so may increase component count, board area, power, security exposure, qualification burden, or system cost.
The framework must therefore distinguish true product requirements from architectural assumptions presented as requirements.
Common failure mode: Eliminating viable technologies because the initial memory architecture is treated as immutable.
Gate 5 — Analog and Mixed-Signal Requirements
Decision question: Which analog characteristics determine product performance, and how strongly do they constrain process technology?
Typical classification: Hard constraint for minimum capability; optimization criterion thereafter.
Relevant characteristics may include matching, noise, voltage headroom, process variability, passive quality, precision, and ADC/DAC or sensor-interface performance.
Analog content also changes the economics of scaling.
Precision devices, passives, high-voltage structures, NVM, ESD, and pad-limited dimensions may receive substantially less area benefit from a node migration than synthesized logic.
The economically important question is: What percentage of the economically relevant die actually benefits from scaling?
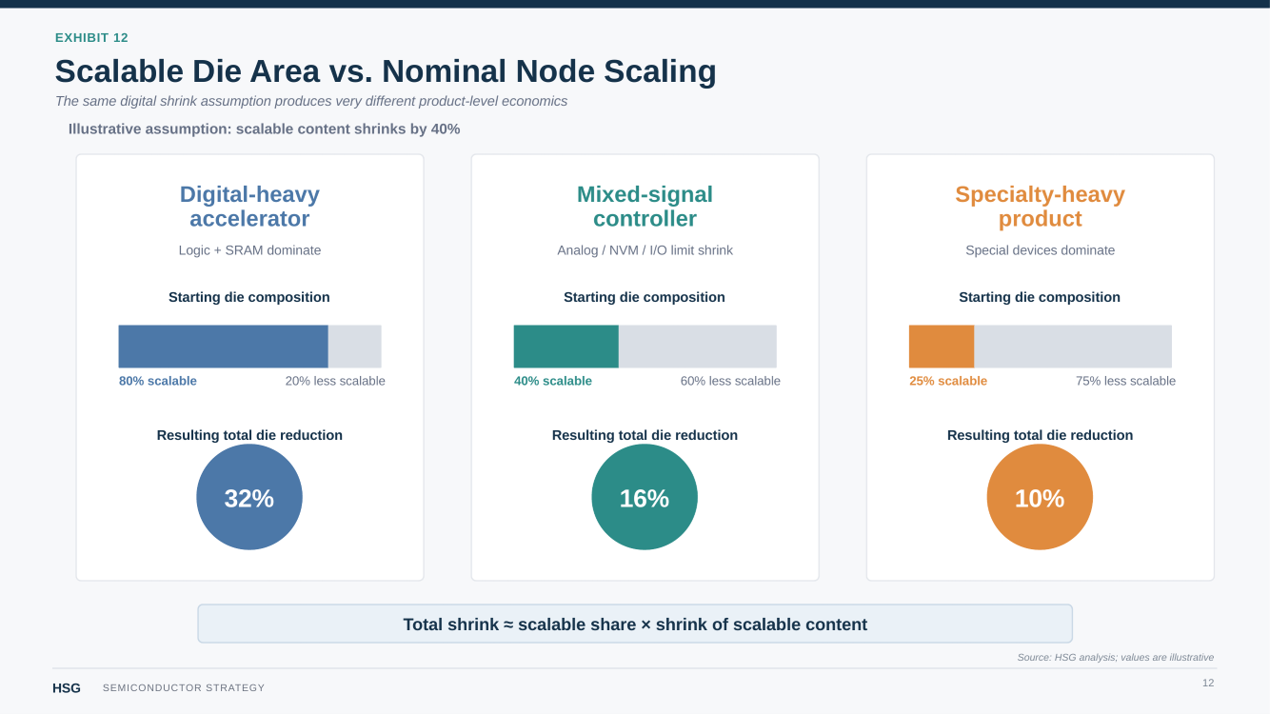
If digital logic represents 25% of an illustrative mixed-signal die and migration reduces that portion by 40%, the direct reduction in total die area is only 10% before considering changes elsewhere.
A device that is 70–80% scalable logic and SRAM presents a fundamentally different business case.
Process-specific scaling assumptions should therefore be validated through realistic floorplanning rather than inferred from nominal node ratios.
Common failure mode: Applying digital scaling expectations to the entire die.
Gate 6 — RF Requirements
Decision question: Do RF requirements materially constrain the feasible technology classes?
Typical classification: Application dependent; potentially a hard constraint.
Where RF is central to the product, relevant considerations include transistor performance at the target frequency, substrate characteristics, noise, passive quality, and model maturity.
A general-purpose CMOS technology may technically implement a function while a specialized RF technology provides materially better performance, design margin, or power efficiency.
Common failure mode: Selecting the general-purpose process first and treating RF performance as a downstream circuit-design problem.
Gate 7 — Digital Performance and Density
Decision question: How much customer and economic value is created by additional digital performance and integration?
Typical classification: Hard constraint at the minimum performance threshold; optimization criterion thereafter.
Relevant metrics include compute throughput, achievable frequency, logic density, SRAM density, interconnect performance, and power-performance-area.
For a predominantly digital product, scaling may reduce finished die area materially, enable more compute within a fixed envelope, or improve performance within a power limit. If those improvements affect customer value or unit economics at sufficient volume, aggressive scaling can justify substantial development investment.
For an analog-heavy product, the same nominal node migration may create far less value.
The decision should therefore be based on effective product scaling, not nominal transistor scaling.
Engineering should quantify the scalable share of die area, expected finished die size, SRAM and interconnect behavior, product-level power benefit, customer value of incremental performance, and the volume available to monetize the improvement.
Common failure mode: Treating density or benchmark performance as a proxy for product value.
Architectural Checkpoint — Does It All Need to Be on the Same Die?
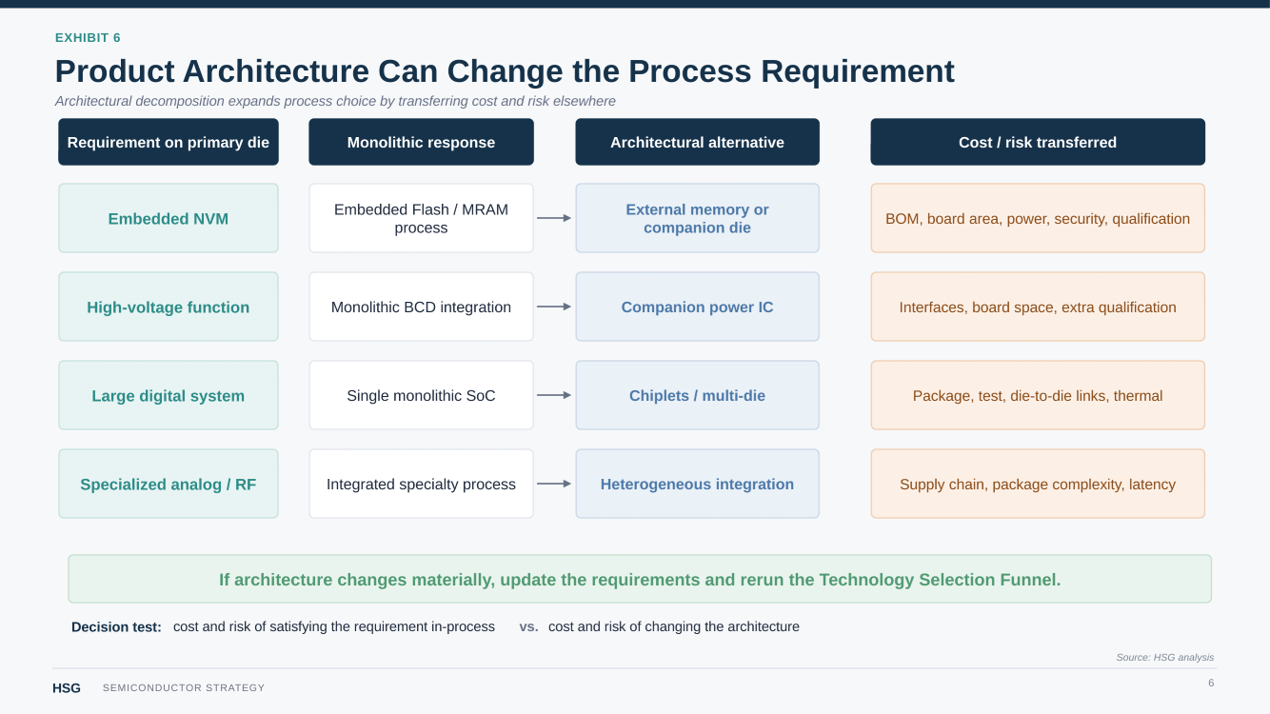
The team should challenge one of the assumptions most likely to constrain process selection unnecessarily: Does the product truly require all of these functions on the same die?
A requirement that appears to force the primary die toward a particular process technology may instead be a consequence of the current architecture. Embedded memory can move off-chip or onto a companion die. High-voltage functions can be separated from low-voltage logic. Specialized RF, photonic, or analog functions can use different process technologies. Large digital systems can be partitioned into chiplets.
Architectural decomposition can therefore expand the process technology universe by allowing individual functions to use technologies better suited to their requirements.
But decomposition increases complexity. External memory can increase latency, power, security exposure, component count, and board area. Companion ICs add interfaces and qualification requirements. Chiplets introduce die-to-die interfaces and high package cost. If the selection funnel looks extremely narrow, or struggles to optimize any commercial criteria, multi-die approaches provide excellent alternatives. This decision compares two complete product architectures:
Cost and risk of accommodating the requirement in the primary process technology vs. Cost and risk of changing the architecture to remove that process requirement.
This comparison should be followed by returning to the top of the funnel and re-evaluating after revising the hard and soft criteria according to the new architecture. A good rule of thumb: a process constraint should remain hard when architectural decomposition creates greater product-level penalties than it removes. It should be challenged when partitioning materially improves economics, performance, schedule, or technology choice.
Gate 8 — Reliability and Qualification
Decision question: Does the process technology have the maturity, characterization, and qualification foundation required to support the product with acceptable risk?
Typical classification: Frequently a hard constraint.
Technical capability and qualification readiness are different questions.
A process technology may be physically capable of operating across the required voltage and temperature range while lacking the reliability models, characterization history, qualification maturity, or manufacturing experience required for the target application.
This distinction matters particularly in automotive, industrial, aerospace/defense, medical, and other applications where failure consequences or qualification requirements are significant.
The process-selection team should distinguish explicitly between capability and maturity.
Capability: Can the process technology implement the product and operate under the required conditions?
Qualification maturity: Is there sufficient evidence to demonstrate that capability within an acceptable engineering and schedule risk?
Depending on the product, the second question may involve extended-temperature behavior, device aging, electromigration, data retention, process variation, long-duration reliability, and application-specific qualification requirements.
A less mature process technology may ultimately satisfy the same target but require additional characterization, conservative design margins, reliability testing, or customer validation. Those activities have severe economic consequences even if no fundamental technical failure occurs: they consume scarce engineering resources and can delay qualification and revenue.
Qualification status should therefore be verified for the specific process technology and application rather than inferred from the nominal technology node or general market positioning.
Common failure mode: Treating qualification as a downstream execution activity when the maturity required to qualify the product can materially change the technology decision.
Gate 9 — Product Lifetime and Technology Maturity
Decision question: Is the process technology appropriate for the expected commercial life and roadmap of the product family?
Typical classification: Optimization criterion, although lifecycle requirements can create hard constraints.
Product lifetime changes the value of process maturity, accumulated engineering knowledge, qualification leverage, and migration risk.
A consumer product with a two- to four-year commercial window may place substantial value on current performance and rapid market entry. Long-term platform continuity may matter less because the product will be replaced before another migration becomes economically relevant.
An industrial product expected to ship for ten to fifteen years or longer creates a different optimization problem. Qualification investment, software, customer validation, IP, test infrastructure, and engineering knowledge may remain economically relevant for more than a decade. An unplanned migration can impose costs on both the semiconductor company and its customers.
Lifecycle analysis should therefore consider:
● Expected production duration. ● Planned derivatives. ● IP and software reuse. ● Qualification leverage. ● Likelihood and cost of future migration. ● Performance and integration headroom required by the roadmap.
The objective is not maximum longevity. Paying today for speculative future requirements can destroy value just as easily as choosing a platform with insufficient headroom.
The relevant question is whether the credible product roadmap materially changes today's process decision.
A more advanced technology may be justified for a long-lived product if it enables several planned derivatives or avoids a foreseeable migration. A mature technology may remain preferable if it supports the roadmap while reducing development and qualification risk.
Supplier-specific commitments regarding long-term capacity and manufacturing availability belong in Phase II. At this stage, lifecycle analysis determines what the process technology strategy must support.
Common failure mode: Optimizing the first product while ignoring the cumulative economics of the platform that follows it.
Gate 10 — Packaging and Integration Constraints
Decision question: Does the intended packaging architecture materially affect which process technologies remain viable?
Typical classification: Application dependent.
For many products, packaging follows process selection. For others, process and package architecture must be evaluated together.
Phase I should determine whether packaging architecture changes the feasible process technology set or the economics of the alternatives. Selection among specific packaging ecosystems, manufacturing partners, and commercial offerings belongs later.
High-performance compute provides the clearest example. A product relying on HBM, chiplets, 2.5D or 3D integration, unusually high-current delivery, or aggressive thermal management may require the primary die to support particular interfaces, power-delivery structures, thermal characteristics, or integration schemes.
Packaging can also enable process specialization. Instead of forcing digital compute, analog, high-voltage circuitry, and memory onto a common process technology, heterogeneous integration can place each function on a more appropriate platform.
The benefit must be evaluated against the resulting system penalties. Additional dies and advanced integration can increase package cost, test complexity, thermal challenges, qualification burden, and engineering effort.
Common failure mode: Optimizing die and package independently when system architecture makes their economics and performance inseparable.
Gate 11 — Economic Viability
Decision question: Does this process technology produce attractive product-level economics under realistic assumptions?
Typical classification: Final optimization gate.
At this point, every surviving process technology should be capable of implementing the product. The question changes from:
Can this technology build the product?
to:
Should this technology build the product?
The economic comparison should include the variables capable of changing the recommendation:
● Expected production volume. ● Finished die area. ● Processed wafer economics. ● Gross dies per wafer. ● Yield and yield maturity. ● Cost per good die. ● Mask and process-specific NRE. ● Engineering and verification effort. ● IP acquisition or migration. ● Qualification. ● Test. ● Packaging. ● Time-to-market. ● Expected product lifetime.
No individual metric answers the question.
A lower wafer price does not guarantee lower silicon cost. A higher-cost technology may create greater enterprise value if its performance improves ASP, system cost, market share, competitive differentiation, or roadmap leverage.
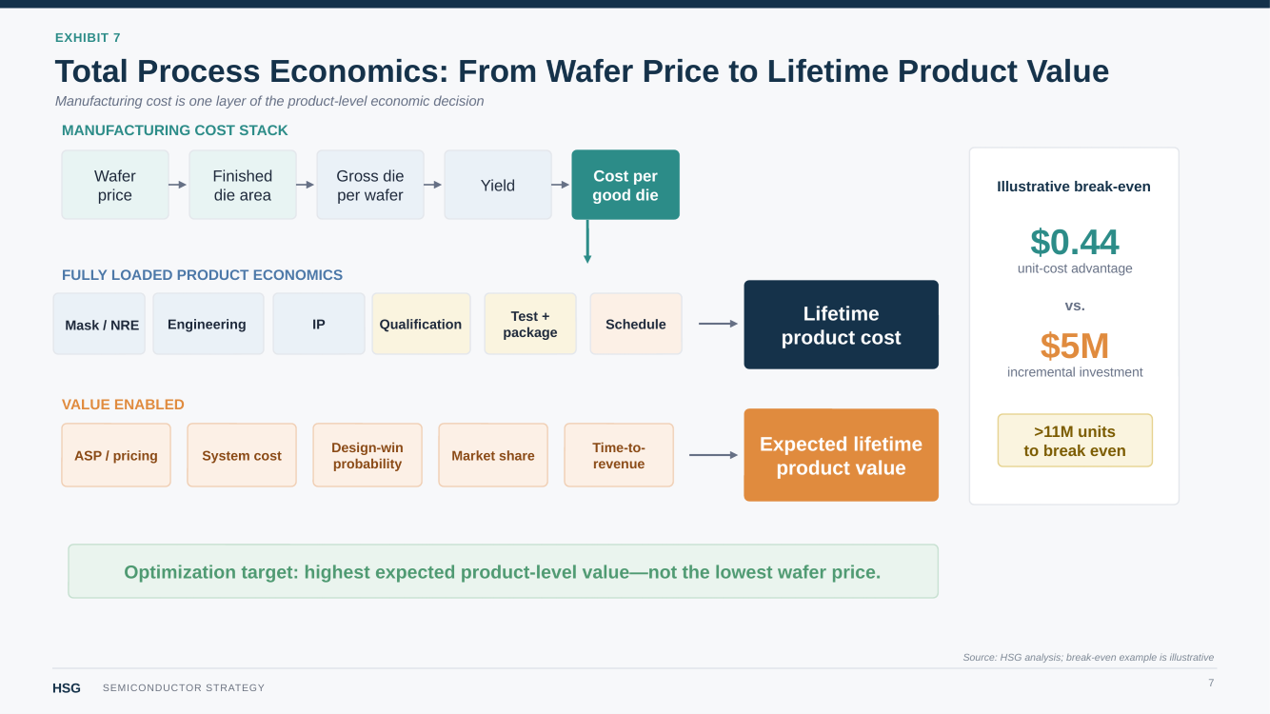
Consider a deliberately simplified illustrative comparison:
Economic Variable Technology A Technology B Processed wafer cost $2,000 $3,200 Good die per wafer 500 900 Silicon cost per good die $4.00 $3.56 Incremental development investment Baseline +$5M
Technology B has the higher wafer price but lower silicon cost per good die. Yet its $0.44 unit advantage requires more than 11 million units simply to recover the illustrative $5 million incremental development investment, before accounting for qualification, test, packaging, schedule, cost of capital, or other differences.
The numbers are illustrative; actual economics require process-specific wafer pricing, die geometry, yield assumptions, test costs, package costs, and commercial terms. The purpose is to expose the economic structure of the decision.
Volume frequently determines which effect dominates. At low or uncertain volume, engineering and NRE can overwhelm modest unit-cost improvements. At high volume, relatively small improvements in recurring die economics can justify substantial upfront investment. For high-ASP products differentiated by performance, the largest economic benefit may come from additional revenue rather than manufacturing savings.
The same discipline applies to die shrink. A 20% reduction in finished die area is valuable only to the extent that its manufacturing, performance, or product benefits exceed the cost required to achieve it.
The final economic model should therefore include sensitivity analysis rather than a single-point forecast. Management should know which assumptions—volume, die area, yield, ASP, development cost, qualification, or schedule—cause the preferred technology to change.
Funnel Output — A Defensible Technology Shortlist
The HSG funnel does not create artificial precision by forcing a winner before the available evidence supports one.
Its output should normally be two to five credible candidate process technologies.
For each survivor, the organization should be able to state:
Required Output Decision Question Basis for inclusion Why is this technology still viable? Principal technical advantage Where does it outperform alternatives? Principal economic advantage What creates product-level value? Major disadvantage What tradeoff must be accepted? Key assumptions What must be true for the case to hold? Unresolved risks What remains uncertain? Elimination conditions What new information would remove it?
Rejected technologies should retain a concise elimination rationale. This prevents options from repeatedly re-entering the discussion unless a requirement, architecture, or decision-driving assumption has actually changed.
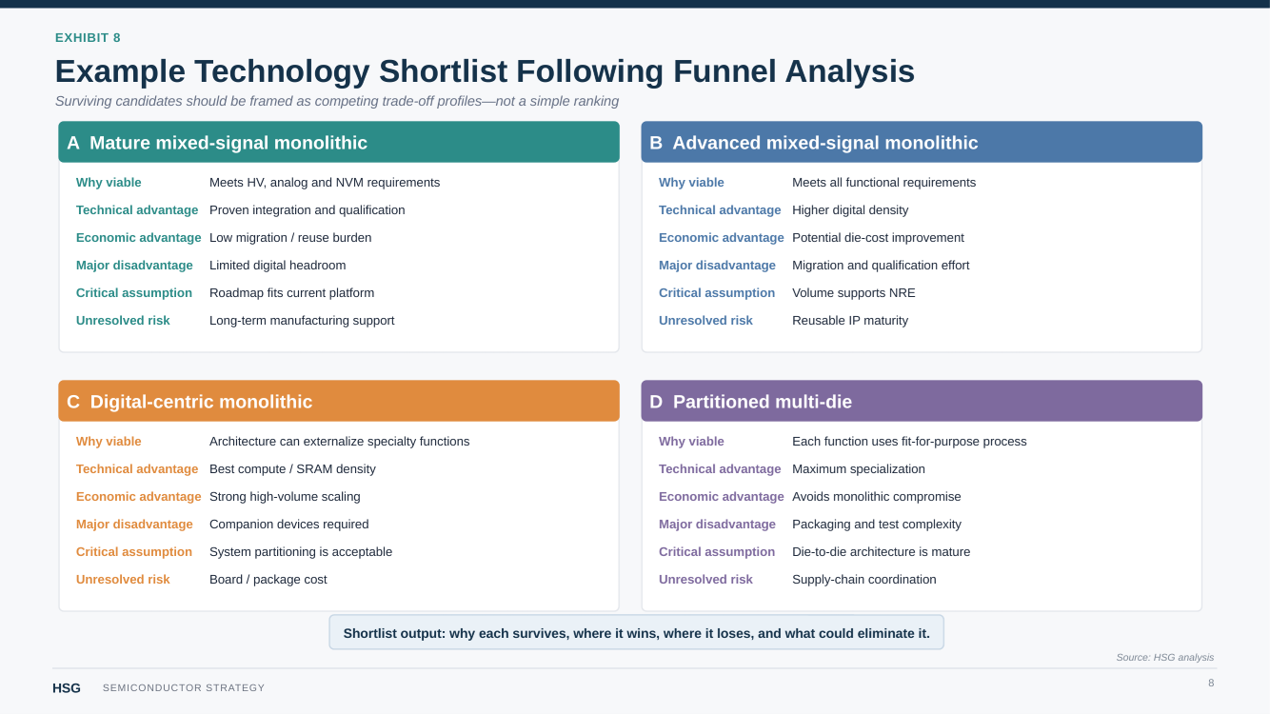
The surviving technologies are technically defensible and economically plausible. Selecting among them now requires resolving tradeoffs that engineering analysis alone cannot settle.
5. Organizational Dynamics and Decision Governance
At the shortlist stage, disagreement is often evidence that the real tradeoffs have become visible.
Design engineering may prefer the candidate with the greatest technical margin. Architecture may favor the platform with the most roadmap headroom. Operations may prefer greater maturity and manufacturability. Finance may favor lower risk-adjusted development investment. Product management may prioritize market timing or differentiation. Supply chain may value resilience and sourcing flexibility.
Each position can be rational because each function experiences a different consequence of the same technology decision. Good process selection separates constraints from preferences, evidence from assumptions, and expected outcomes from risk.
Constrain First, Then Optimize
Hard technical requirements should remain non-negotiable unless the underlying product requirement or architecture changes. A technology that cannot satisfy a mandatory voltage, memory, reliability, or performance requirement should not recover through superior scores elsewhere.
Among technologies that satisfy those constraints, management must make an informed business decision to determine which objectives deserve the greatest weight amongst competing internal philosophies.
A venture-backed startup approaching a financing milestone may rationally assign substantial value to schedule and engineering reuse. A long-lived industrial platform may place greater weight on qualification risk and lifecycle flexibility. A high-performance compute product may prioritize performance per watt because it directly determines customer economics.
The weighting should be established before final scoring so that the framework does not become a mechanism for justifying a predetermined answer.
Leveraging cross Organizational Conflict
Cross-functional conflict between engineering, sales, and operations becomes useful when teams must explain what would need to be true for their preferred technology to win. This helps management gain visibility into the product tradeoffs first-hand.
If engineering favors a process because it is expected to reduce die area by 25%, operations should ask how much the finished die shrinks, what incremental NRE is required, at what lifetime volume the investment breaks even, and how sensitive the result is to yield and schedule.
If operations argues that another technology is "lower risk," management should identify the risk explicitly: process maturity, qualification, yield uncertainty, organizational experience, or manufacturing readiness.
Many apparent technology disagreements can easily be tested on a neutral ground rather than tribal favor: expected volume, schedule value, die area, IP reuse, technical headroom, or acceptable risk.
Use Decision Matrices as Decision Aids
A weighted decision matrix can expose tradeoffs efficiently once the funnel has eliminated infeasible technologies.
It should not manufacture mathematical certainty.
A score of 8.4 versus 8.1 is not meaningful if the difference depends on uncertain assumptions about volume, yield, or schedule. The matrix is valuable when it shows why the candidates differ and which priorities drive the result.
The final decision should therefore combine quantitative comparison with explicit sensitivity analysis.
Establish Clear Decision Ownership
A practical governance model has four elements:
- Agree on non-negotiable constraints. Architecture and engineering document the requirements every candidate must satisfy.
- Agree on optimization priorities. Product and executive leadership determine which business outcomes deserve the greatest weight.
- Surface assumptions and risks. Each function identifies the uncertainties most capable of changing the recommendation.
- Assign a decision owner. One executive owns the final technology decision and the risks accepted with it.
Cross-functional teams provide evidence. They should not share ambiguous collective accountability.
The final decision record should capture the selected technology, credible alternatives, major assumptions, accepted risks, and the conditions that would justify reopening the decision.
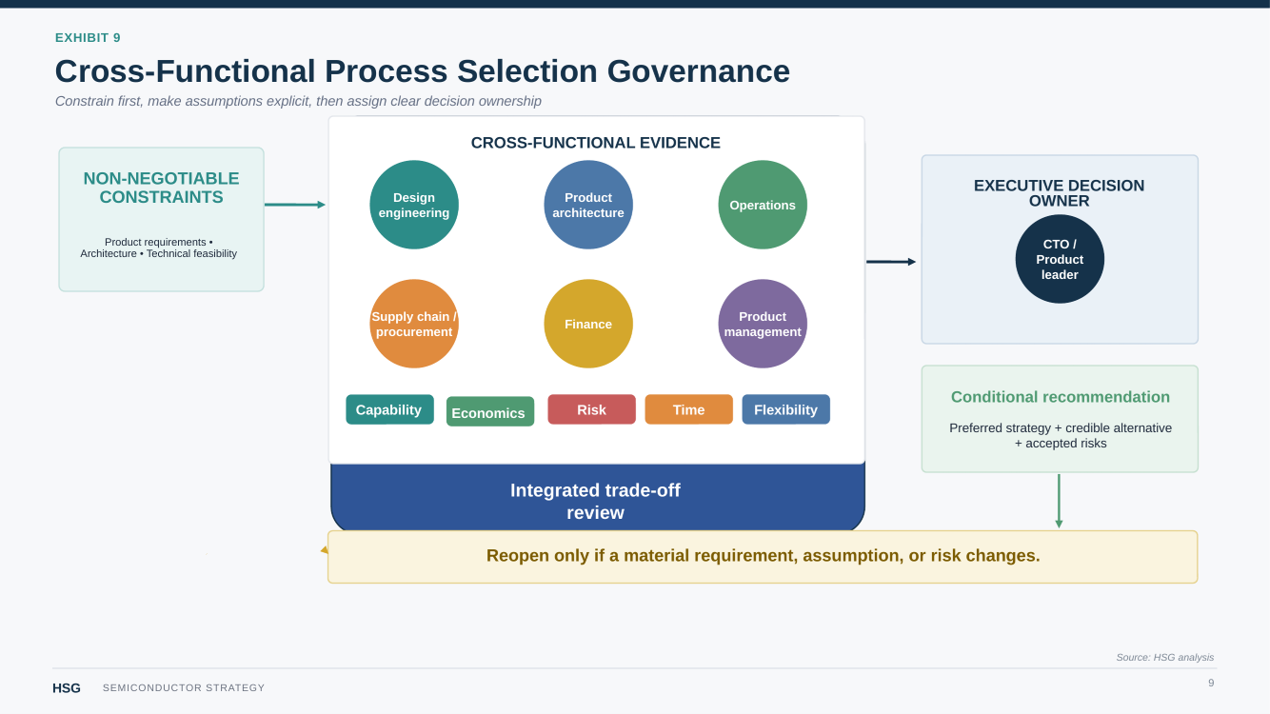
Good governance does not eliminate disagreement. It converts disagreement into explicit tradeoffs and makes the logic of the final decision auditable.
6. Case Study 1 — 180 nm BCD on 200 mm vs. 130 nm BCD on 300 mm
Consider a hypothetical semiconductor company developing the next generation of an industrial mixed-signal controller used in motor drives, robotics, and factory automation. The device integrates high-voltage interfaces, precision analog, embedded NVM, digital control, safety and diagnostic functions, and industrial communications.
The product is a derivative of an existing architecture, not a greenfield design. However, the design team has new features they’d like to add to the design for competitive advantage.
All numbers below are illustrative assumptions intended to demonstrate the methodology rather than characterize any specific foundry or process technology. Actual economics vary materially by process technology, foundry, yield, commercial terms, and die geometry.
Product Requirement Illustrative Assumption Commercial lifetime 12–15 years Lifetime production 6–8 million units Peak annual volume 600,000–800,000 units Digital share of existing die ~30% Embedded NVM Required High-voltage devices Required Primary differentiation Mixed-signal integration, reliability Qualification Extended-temperature industrial Schedule objective Qualified production within ~30 months
After technical screening, two technology configurations remain viable: 180 nm BCD on 200 mm wafers and 130 nm BCD on 300 mm wafers.
Initial Hypothesis: 130 nm Should Win
Management initially favors 130 nm. The smaller technology node should reduce digital area, while the larger wafer provides substantially more usable silicon area. The platform also offers greater digital headroom for future derivatives.
The hypothesis is reasonable, but the mistake would be accepting it before translating those advantages into finished-product economics.
The existing die is approximately 30% digital logic, 25% embedded memory, 30% analog and high-voltage circuitry, and 15% I/O, ESD, and other structures.
Assume, illustratively, that the digital portion shrinks by 40% on 130 nm. Because digital logic represents only 30% of the starting die, that contributes approximately 12 percentage points of total die reduction before considering changes elsewhere. Embedded memory may scale differently; precision analog, high-voltage devices, and pad-limited structures may shrink considerably less.
A preliminary floorplan therefore estimates a finished-die reduction of approximately 10–20%, rather than the reduction a simple comparison of nominal node dimensions might imply.
The 130 nm technology still produces a smaller die. The question is whether that shrink creates enough recurring economic value to overcome the fixed cost, schedule, and risk of migration.
Wafer Economics Favor 130 nm, but Not Necessarily the TCO
The finance team develops a simplified cost-per-good-die comparison.
Illustrative assumptions:
Metric 180 nm / 200 mm 130 nm / 300 mm Finished die area ~30 mm² ~25.5 mm² Processed wafer cost $1,500 $3,500 Illustrative gross dies per wafer ~965 ~2,640 Mature yield 95% 92% Illustrative good dies per wafer ~915 ~2,430 Illustrative silicon cost per good die ~$1.64 ~$1.44
The result is useful because it does not simply support the mature technology. Under these assumptions, 130 nm on 300 mm provides approximately $0.20 lower silicon cost per good die despite the substantially higher processed-wafer price.
Across six to eight million lifetime units, that corresponds to approximately $1.2–1.6 million of illustrative recurring silicon savings.
That advantage is real, but it does not resolve the decision.
The relevant question is whether $1.2–1.6 million of expected lifetime silicon savings is sufficient to pay for incremental mask and process-specific NRE, IP migration, additional engineering effort, qualification, schedule exposure, and the opportunity cost of scarce technical resources.
If those incremental costs exceed the recurring silicon benefit, 130 nm needs another source of value—performance, roadmap leverage, higher volume, or stronger future reuse—to justify migration.
This is the product-level comparison that wafer diameter and wafer price alone cannot provide.
Migration Economics Favor Reuse
Because the product is a derivative rather than a greenfield design, migration economics depend heavily on what can be reused.
The 180 nm implementation preserves substantial process-dependent engineering from the existing platform. Moving to 130 nm requires redesign and requalification in the areas where portability is weakest: precision analog blocks, high-voltage interfaces, ESD structures, embedded-memory integration, characterized mixed-signal IP, and portions of the physical verification environment. Digital RTL is comparatively portable, but it is not the dominant source of migration risk for this product.
Under the illustrative program assumptions, the project team estimates that the 130 nm option requires approximately 20–30% more engineering effort through qualification. The incremental work includes model validation, analog redesign, physical implementation, verification, characterization, and product qualification.
The economic consequence extends beyond direct project expense. Analog, verification, and product-engineering resources are constrained across the portfolio. Assigning them to migration delays other roadmap work. The migration hurdle therefore includes both the resources consumed by this program and the value of the development they displace.
The schedule reflects the same tradeoff:
Illustrative Milestone 180 nm 130 nm Tape-out Month 17 Month 20 Silicon validation complete Month 21 Month 24 Qualification complete Month 27 Month 32
These are illustrative program assumptions, not industry benchmarks.
The additional five months postpone customer qualification and revenue without correcting a performance limitation in the existing architecture. If the product required materially greater compute or integration capability, the schedule penalty might be justified. Under the current requirements, it is primarily an economic and execution cost.
Integrated Decision
Decision Dimension 180 nm / 200 mm 130 nm / 300 mm Required technical capability Meets Meets Digital performance headroom Adequate Superior Effective die scaling Baseline ~10–20% smaller Recurring silicon economics Higher Moderately lower Existing IP reuse High Moderate Incremental engineering effort Lower Higher Qualification risk Lower Higher Schedule confidence Higher Lower Long-term digital headroom Moderate Higher Overall base-case fit Preferred Credible alternative
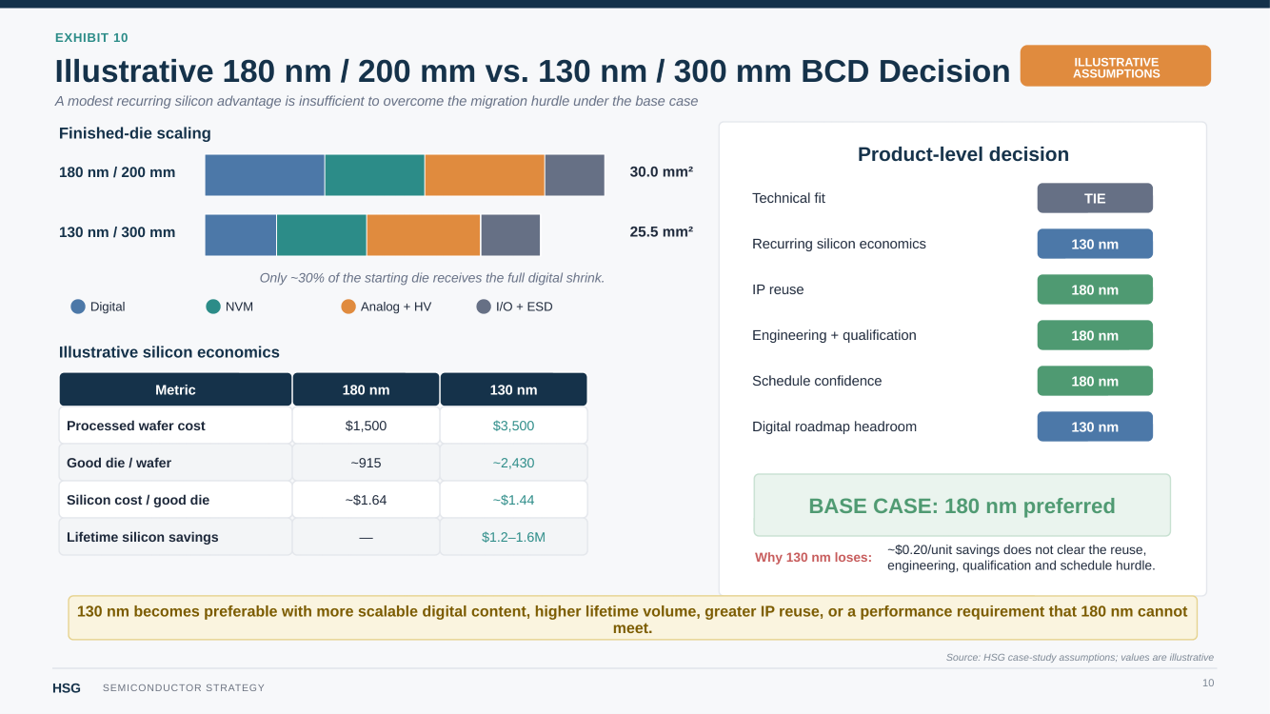
Under the base-case assumptions, the recommendation remains 180 nm BCD on 200 mm.
Why Did 130 nm Lose?
130 nm does not lose because its manufacturing economics are inferior. Under the illustrative assumptions, they are better.
It loses because the magnitude of that advantage is insufficient to compensate for the migration premium.
Four assumptions drive the result:
First, only a minority of the economically relevant die scales aggressively, limiting the finished-die reduction. Second, the resulting recurring silicon advantage is approximately $0.20 per unit in the illustrative model—valuable, but modest relative to the engineering program. Third, the derivative design carries significant reusable process-dependent IP, increasing the cost of migration relative to a greenfield product. Fourth, migration adds engineering and qualification work and approximately five months of schedule without addressing a customer-valued performance deficiency.
The decision is therefore not a choice between cheaper and more expensive silicon. It is a choice between a modest recurring unit-cost improvement and a larger upfront migration, schedule, and execution commitment.
What Would Make 130 nm Win?
The recommendation should reverse when the economic crossover moves materially.
A larger digital share of the die would increase finished-die shrink and recurring cost savings. Higher lifetime volume would multiply even a modest cost-per-good-die advantage. A greenfield design would reduce the value of the existing 180 nm ecosystem. Greater reusable 130 nm analog, memory, and interface IP could narrow both engineering effort and schedule. More demanding product requirements could make the additional performance or integration headroom commercially necessary.
Using the illustrative $0.20 per-unit silicon advantage, every additional five million lifetime units contributes roughly another $1 million of recurring silicon savings before other effects. Management can therefore compare the expected migration premium directly against the volume and die-economics assumptions required to recover it.
The useful output is not that 180 nm wins. It is the decision boundary: under the current architecture, reuse, volume, and schedule assumptions, 180 nm produces the stronger product-level outcome; move those assumptions far enough, and 130 nm becomes the better decision.
Case Study 2 — 7 nm vs. 3 nm for a High-Performance Digital Accelerator
Consider an established semiconductor company developing a next-generation accelerator for data-center inference and high-performance networking workloads.
The product is predominantly digital, operates near its system power limit, and competes in a market where throughput, performance per watt, and deployment density directly influence customer economics. The architecture uses HBM through advanced packaging and is expected to support two subsequent derivatives.
The following figures are illustrative assumptions intended to demonstrate the decision methodology, not characterize generic 7 nm or 3 nm process technologies.
Product Requirement Illustrative Assumption Commercial lifetime ~4 years Lifetime volume ~4 million units Target ASP ~$2,500 Maximum accelerator power ~500 W Economically scalable die content ~80% digital logic/SRAM Memory architecture HBM Integration Advanced 2.5D package Required production window ≤30 months Planned derivatives 2
Both a mature 7 nm-class FinFET process technology and a 3 nm-class process technology satisfy the baseline architecture.
Management initially favors 7 nm because the organization has greater implementation experience, more reusable IP, better-understood design flows, and higher schedule confidence. The development investment is also materially lower.
Engineering and product leadership make a different argument: 3 nm should not be evaluated merely as a more expensive implementation of the same accelerator. If additional density and power efficiency materially improve the product's sources of customer value, the process technology may change the commercial outcome.
Does Scaling Reach the Customer?
The 7 nm implementation can meet the baseline compute requirement but leaves limited power and die-area headroom.
Under the illustrative design assumptions, 3 nm could provide:
● 25–35% higher application-level performance ● 20–30% better performance per watt ● 30–40% lower area for scalable digital content
These are scenario assumptions rather than generic claims about 7 nm-to-3 nm scaling. Actual results depend on the specific process technology, libraries, SRAM, voltage, interconnect, physical design, and architecture.
Unlike the mixed-signal BCD case, approximately 80% of the economically relevant compute die can benefit materially from scaling. A preliminary implementation model therefore assumes approximately 700 mm² on 7 nm versus 500 mm² on 3 nm for equivalent functionality, or alternatively allows some of the recovered area to be reinvested in additional compute or SRAM.
The relevant question is still not transistor density. It is whether the customer can use the additional capability.
The architecture team must test whether HBM bandwidth, memory capacity, package power delivery, thermal limits, interconnect, or software utilization become the system bottleneck. If additional compute sits idle because memory bandwidth is saturated or package power cannot support it, the economic value of 3 nm falls sharply.
The base case assumes these constraints can support the higher-performance implementation.
The Incremental Investment Is Significant
The comparison should focus on technology-dependent program costs, not imply that the figures below represent the complete all-in cost of developing a modern high-performance accelerator.
Illustrative assumptions:
Technology-Dependent Program Cost 7 nm 3 nm Masks and process-specific NRE $15M $30M IP acquisition / migration $12M $22M Incremental implementation & verification $45M $65M Silicon validation / contingency $18M $28M Illustrative total $90M $145M
Under these assumptions, choosing 3 nm requires approximately $55 million of incremental technology-dependent investment.
The lower-risk 7 nm case is therefore substantial. It preserves more existing IP, relies on better-understood implementation and signoff flows, and reduces the amount of new engineering infrastructure that must be created. Manufacturing and yield behavior may also be better understood, depending on the specific process implementation.
3 nm must earn that additional $55 million.
Value Creation vs. Value Capture
The strongest argument for 3 nm is not lower silicon cost, but the possibility of producing a product with meaningfully better customer economics.
Greater performance per watt may allow a customer to:
● Process more workload within a fixed rack-power envelope. ● Reduce accelerator count for a given workload. ● Increase compute density within an existing system architecture. ● Reduce cooling or infrastructure requirements. ● Extend the useful performance life of the deployed platform.
Those benefits can be economically significant without automatically accruing to the semiconductor supplier.
The company must determine how much of the value it can capture through higher realizable ASP, greater design-win probability, increased market share, or improved economics across derivative products.
At an illustrative four million lifetime units, the additional $55 million investment corresponds to approximately:
$55M ÷ 4M units = $13.75 per lifetime unit
Before considering schedule, yield, risk, or cost of capital, 3 nm therefore needs to create and capture roughly $14 per unit of incremental economic value to recover the technology-dependent development premium. The risk is that the company does not know with certainty that four million units will ship, that customers will value the incremental performance, or that the 3 nm program will execute on schedule.
The relevant commercial question is: Does 3 nm improve product differentiation enough to increase expected enterprise value by more than the incremental investment and execution risk?
Schedule and Execution Risk Are the Counterweight
The illustrative schedule assumes production readiness in approximately 26 months on 7 nm and 30 months on 3 nm.
The four-month difference should be priced according to the market rather than treated as a generic penalty.
If both schedules remain inside the relevant customer qualification window, the delay may be manageable. If the 3 nm program misses a hyperscale platform decision, the lost design opportunity can overwhelm the value of superior silicon.
The 3 nm risk register therefore concentrates on:
● IP readiness ● Physical implementation complexity ● Yield assumptions ● Package integration ● Schedule confidence ● Engineering opportunity cost
The two planned derivatives strengthen the 3 nm case because they allow the company to spread platform investment across more than one product. That value should be included only if those derivatives represent credible roadmap commitments rather than speculative future reuse.
Integrated Decision
Decision Dimension 7 nm 3 nm Baseline compute requirement Meets Exceeds Performance-per-watt headroom Moderate High Scalable die content High High Technology-dependent investment Lower Substantially higher Existing IP reuse Higher Lower Implementation familiarity Higher Lower Schedule confidence Higher Lower Execution risk Lower Higher Competitive differentiation Moderate High Derivative-product headroom Constrained Strong Overall base-case fit Credible alternative Preferred
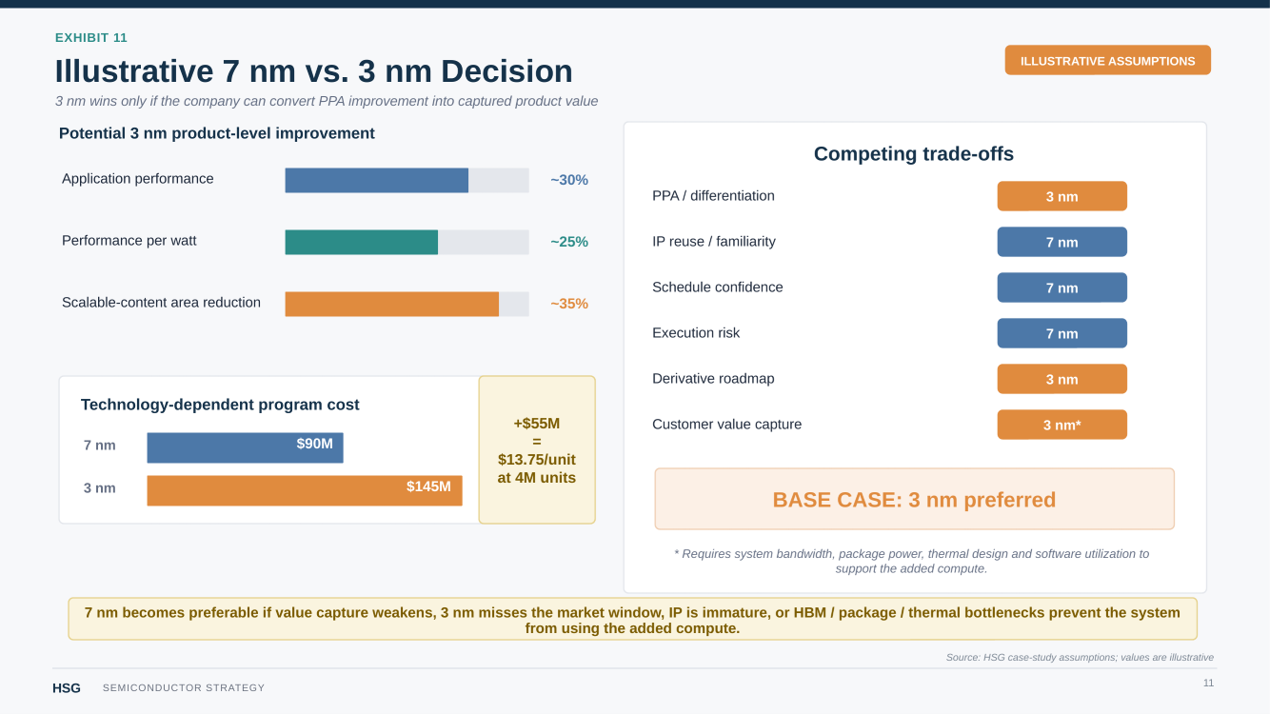
Under the stated assumptions, the recommendation is 3 nm.
Why Did 7 nm Lose?
7 nm loses because the base-case product is approaching meaningful power and die-area limits while its competitive differentiation depends directly on performance per watt and compute density.
Most of the die benefits from scaling. The package and memory system are assumed capable of exploiting the additional compute. Customers are assumed to place sufficient value on the resulting system-level performance, and the 30-month schedule remains inside the relevant market window. Planned derivatives also provide a credible path to reuse part of the incremental platform investment. Here, we arrive at a conclusion that supports the initial theses: filtering through the lens of maximizing the products unique selling points.
Under those conditions, the lower development cost and execution risk of 7 nm do not compensate for the expected loss in competitive position.
What Would Reverse the Recommendation?
The decision moves toward 7 nm if the assumptions supporting value capture weaken. Lower lifetime volume increases the incremental cost per shipped unit. Reduced customer willingness to value additional PPA weakens the commercial return. IP immaturity or implementation difficulty can increase cost and push 3 nm beyond the market window. HBM bandwidth, package power, thermal limits, or software utilization may prevent the system from exploiting the additional compute. Architectural improvement on 7 nm may also close enough of the performance gap that the advanced-node premium no longer produces sufficient differentiation.
The most consequential sensitivity is likely schedule. If 3 nm causes the product to miss a major customer deployment cycle, its superior technical characteristics may no longer produce the superior business outcome.
The recommendation is therefore conditional: 3 nm wins because the base case assumes that substantial scalable die content, binding PPA constraints, customer value capture, derivative reuse, and sufficient schedule confidence collectively generate more value than the additional development investment and execution risk. If those assumptions weaken materially, 7 nm becomes the stronger decision.
8. Decision Principles and Common Failure Modes
The framework can be reduced to eight management disciplines that should be tested before approving a technology strategy.
1. Start With the Product, Not the Node
Process selection should begin with the product's sources of customer value and competitive differentiation—not a preferred technology node or manufacturing platform. Starting with "this belongs on 28 nm" or "we need 3 nm" creates anchoring. Requirements then become evidence for a preferred answer rather than tests of it.
Failure mode: A predetermined technology or incumbent supplier relationship becomes the starting point.
Management test: If technology and supplier names were removed from the analysis, would the product requirements still produce the same shortlist?
2. Separate Constraints from Preferences
A requirement should eliminate a technology only when violating it makes the product unacceptable.
Embedded NVM, integration choices, package configuration, performance headroom, and interface requirements can all become embedded in specifications even when they are preferences or architectural choices rather than immutable requirements.
Failure mode: A desirable implementation characteristic acquires veto power because changing it would require additional architecture work.
Management test: Does removing this capability make the product fail, or does it force a different architecture?
3. Challenge the Architecture Before Paying the Process to Solve It
A requirement created by the current architecture should not automatically become a process constraint.
External memory, companion power devices, chiplets, separate RF components, and heterogeneous integration may reopen otherwise attractive technologies. Their costs in packaging, power, latency, qualification, interfaces, engineering, and supply chain—must be compared against the cost of satisfying the requirement monolithically.
Failure mode: Early partitioning choices become permanent specifications without an economic comparison of alternatives.
Management test: Is the process technology solving a genuine product requirement or compensating for an architectural assumption?
4. Determine What Actually Scales
Nominal node scaling does not translate to product-level scaling. The analysis should estimate how digital logic, SRAM, analog, I/O and ESD, high-voltage structures, passives, and specialized devices change on each candidate technology. The relevant concept is scalable die area.
A migration that materially benefits 80% of a digital accelerator creates different economics from one that strongly benefits 25–30% of a mixed-signal ASIC.
Failure mode: Digital density improvement is implicitly applied to the entire die, overstating area reduction and recurring cost savings.
Management test: What percentage of the finished die receives the scaling benefit assumed in the business case?
5. Optimize Product Economics, Not Wafer Price
The relevant economic comparison includes wafer cost, gross dies per wafer, yield, cost per good die, NRE, IP, engineering, qualification, test, packaging, schedule, and lifetime volume.
Even the lowest manufacturing cost may not maximize product value. A more expensive technology can be superior if it materially improves ASP, system economics, design-win probability, competitive differentiation, or time-to-market.
Failure mode: The organization optimizes whichever manufacturing metric is easiest to measure.
Management test: Does the model capture both the costs created by choosing the technology and the customer or enterprise value it enables?
6. Value Accumulated Engineering Investment and Reuse
Engineering capacity, reusable IP, qualification history, characterization data, verification environments, silicon learning, and organizational familiarity all have economic value.
Migration consumes scarce design, verification, physical-design, CAD, product-engineering, qualification, and management resources. It may also discard or partially invalidate prior engineering investment.
The correct comparison is therefore not new wafer economics versus old wafer economics. A new technology must cross a migration hurdle sufficient to justify engineering effort, lost reuse, requalification, schedule, increased uncertainty, and the roadmap work displaced by migration. IP available for purchase and not in the customers’ own portfolio must also be considered in this hurdle for greenfield designs.
This should not become an argument for technological inertia, but viewed as a cost of advancement.
Failure mode: Engineering is treated as free and accumulated process-specific knowledge disappears from the comparison because neither appears on the foundry quotation.
Management test: What existing capability must be rebuilt, and what else could the required engineering organization deliver instead?
7. Price Risk and Schedule Explicitly
Similar expected economics can hide very different distributions of outcomes.
PDK maturity, model accuracy, IP readiness, implementation complexity, qualification, yield ramp, packaging, and manufacturing readiness can ultimately manifest as cost, performance, schedule, or revenue risk.
Where possible, schedule should be connected to consequences such as postponed revenue, missed qualification windows, lost customer platforms, or engineering opportunity cost.
Failure mode: Technologies are compared through optimistic base cases while execution risk appears only as a qualitative footnote.
Management test: What adverse outcome could change the recommendation, and what would it cost the business?
8. Define What Would Change the Decision
Every recommendation should identify the assumptions under which it stops being correct.
Volume, die area, architecture, IP availability, qualification requirements, product lifetime, customer performance needs, and schedule evolve as a program matures.
A strong recommendation therefore identifies both the preferred technology and the conditions under which the credible alternative becomes superior.
Failure mode: Organizational momentum turns a conditional decision into dogma after the assumptions that justified it have changed.
Management test: What specific new information would cause us to choose the alternative?
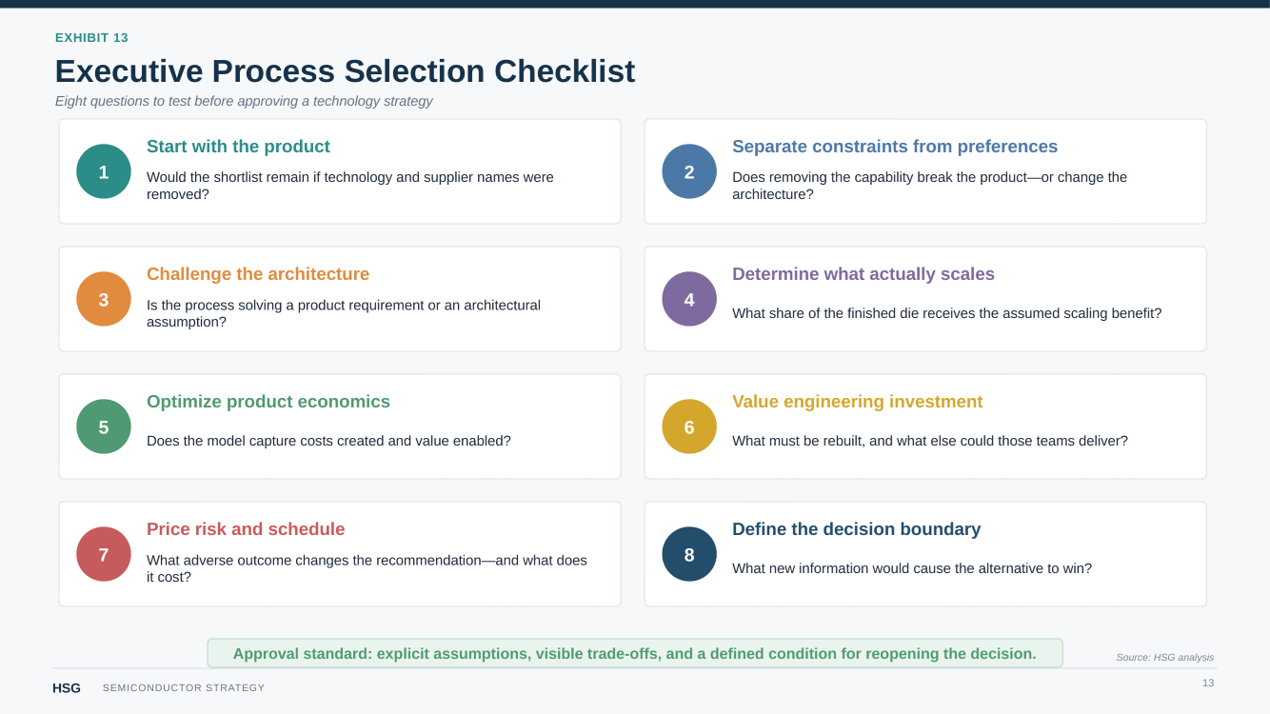
Good process selection depends less on forecasting every variable correctly than on making assumptions explicit, testing the decision against uncertainty, and knowing which new information should—and should not—change the recommendation.
9. From Analysis to a Technology Recommendation
Phase I should culminate in a management decision package, not a technology-node declaration.
"We recommend 65 nm" records an outcome while discarding most of the information management needs to approve, challenge, and later revisit it. A defensible recommendation should make clear why the technology best enables the product's sources of customer value, which assumptions support the conclusion, what risks the organization is accepting, and what developments would change the answer.
The package should be concise enough for executive review while preserving the decision logic.
Decision-Driving Product Requirements
Capture only the requirements that materially influence technology selection—not the complete product specification. These may include voltage domains, performance or power limits, mandatory embedded functions, reliability requirements, lifecycle, or integration constraints.
Each should be measurable and traceable to a customer, system, or business objective.
Hard Constraints
Document what no candidate may violate and why each requirement is genuinely mandatory.
If management cannot explain why violating a requirement makes the product unacceptable, it should be reconsidered as an optimization criterion or architectural assumption.
Architectural Assumptions
Record decisions such as embedded versus external NVM, monolithic versus multi-die implementation, or integrated versus companion power devices separately from product requirements.
These assumptions remain visible because changing them can alter the technology shortlist.
Candidate Technology Shortlist
The Technology Selection Funnel should leave a small number of credible candidates.
For each, the decision package should answer:
Question Required Conclusion Why did it survive? Technical and commercial basis for inclusion Where does it win? Principal source of product-level value Where does it lose? Most important accepted tradeoff What remains uncertain? Assumption or risk most likely to change its position
Management should be able to identify both the preferred technology strategy and the strongest credible alternative.
Decision Matrix
A matrix provides a compact comparison against the optimization priorities established during governance.
Weighted scoring can clarify tradeoffs but should not replace judgment. A narrow numerical lead is not meaningful if the underlying result is sensitive to uncertain assumptions.
The recommendation should remain understandable even if the scores are removed.
Economic Model
Make the assumptions driving the recommendation visible and comparable.
Depending on the product, the model may include expected volume, finished die size, yield, wafer economics, NRE, IP, engineering effort, qualification, packaging, test, and schedule. Where process capability affects differentiation, the model should also capture value enabled through factors such as higher ASP, greater system performance, lower customer cost, or increased design-win probability.
The objective is not forecasting precision. It is economic transparency.
Risk Register
Capture the uncertainties capable of changing the decision separately from expected economics.
Relevant categories may include technical execution, schedule, qualification, manufacturing readiness, economic assumptions, and lifecycle risk. The register should focus on risks with decision relevance rather than becoming an exhaustive program database.
Sensitivity Analysis
For the strongest alternative, ask: What must change for this technology to become preferable?
The answer may be a volume threshold, a different die-area estimate, improved IP availability, an architecture change, a customer requirement, or a schedule shift.
Final Recommendation
The decision package should state:
● Preferred technology strategy ● Credible alternative(s) ● Why the preferred strategy wins ● Major risks being accepted ● Open questions ● Conditions that would reverse the recommendation
A strong conclusion could look as follows: Given the current architecture, product requirements, expected volume, development schedule, and risk profile, Technology A provides the strongest product-level outcome. Technology B remains the credible alternative and should be reconsidered if the identified decision-driving assumptions change materially.
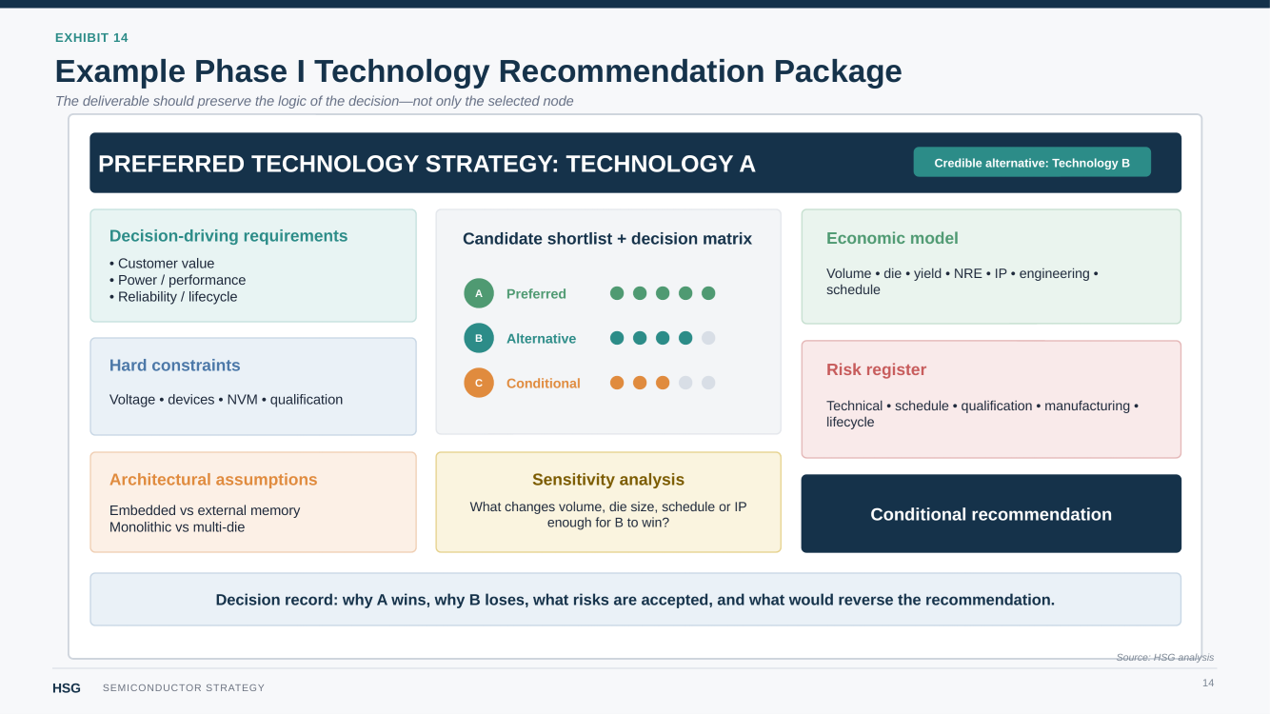
The package also creates an institutional record. When the floorplan changes, new IP becomes available, customer requirements evolve, or volume forecasts move, the organization can determine whether the new information actually affects the basis of the decision, and if a future migration makes sense.
10. Phase I Conclusion
Phase I converts technological ambiguity into a conditional technology strategy.
The objective is not perfect certainty. At this stage, volume, die area, architecture, IP availability, qualification evidence, and schedule may still evolve. Management nevertheless needs a decision strong enough to commit engineering resources without pretending those uncertainties do not exist.
A successful recommendation identifies a preferred technology strategy, a credible alternative, the assumptions that drive the choice, the major risks being accepted, and the sensitivities that define the boundary between the two.
A material change in a hard requirement, architecture, economic assumption, or identified decision sensitivity may justify revisiting the technology strategy. A new process announcement or changing organizational preference should not.
Phase I therefore ends not with a claim that one technology is inherently superior, but with a more useful conclusion:
Given the current product requirements, architecture, economics, schedule, and risk assumptions, this technology strategy produces the strongest product-level outcome. If the identified decision-driving assumptions change materially, the credible alternative should be reconsidered.
The strategy must also be grounded in manufacturing reality. Phase I should verify that credible commercial implementations exist. That is the boundary at which detailed foundry and process evaluation becomes decisive.
Transition to Phase II — Selecting the Foundry and Specific Process
Phase I and Phase II are analytically distinct, but they are not completely independent.
Phase I asks:
What technology strategy best enables this product?
Phase II asks:
Which specific foundry process best executes that strategy?
Phase I should use enough market and manufacturing information to confirm that its shortlisted technology configurations have credible implementations. It should not prematurely allow a preferred foundry, commercial quotation, or familiar PDK to determine the technology strategy.
Phase II performs the implementation-specific comparison.
Technologies carrying the same nominal node or broad label may differ materially across foundries in device characteristics, design rules, metal stacks, embedded options, PDK and model quality, IP availability, qualification evidence, process maturity, yield behavior, capacity, and commercial structure.
Detailed Phase II analysis can therefore feed back into the Phase I shortlist. If a preferred technology strategy depends on unavailable IP, inadequate PDK maturity, unacceptable qualification risk, prohibitive economics, or insufficient manufacturing support, management should revisit the shortlist rather than force the product onto an implementation that no longer supports the original business case.
That feedback loop should be limited to information that materially changes a Phase I assumption.
Phase I determines what technology strategy the product should pursue.
Phase II determines which specific process—and which manufacturing partner—provides the strongest practical implementation of that strategy.